5. Creating a Data Application
- Kajahnan Sivakumar

- Sep 17, 2021
- 3 min read
Updated: Aug 24, 2022
Data App: http://192.168.68.64:8502
Github: https://github.com/kajcryp/Streamlit_App
Key skills demonstrated:
- Supporting ETL Processes
- Data visualisation using Python libraries
- App development
- Python/SQL coding 

## Disclaimer, when clicking on to the app above you'll notice campaigns are named "campaign XX". This is for data confidentiality. This post is to show as best of an example how I learnt various skills in presenting data to solve a problem with test data that I made up.

This should also be considered when looking at the SQL scripts.
Running the app
To view the app, you should download the csv files and copy the Streamlit_app.py file below into your Jupyter Labs.
Before you run the file, make sure you install the Streamlit package to write in your terminal:
pip install streamlit You can then carry on with the Steps as below:

Once you do that, go to Anaconda Prompt or your terminal. Change your directory to the path at which your files are saved like this:
cd C:\Users\User\Documents\StreamlitThen run the command
streamlit run Streamlit_app.pyIf you are working on an operating system outside windows, follow these steps instead: https://docs.streamlit.io/library/get-started/installation

Introduction:
One of the aims I set myself in 2021 was to improve upon my Python and SQL. By setting these goals, I was able to build an interactive Streamlit data web application that showed how many campaigns are sent.
The breakdown of this project and page will be shown below in what the problem is and how I used ETL processes to solve this:
Problem to Solve
E - Extracting the data from Redshift
T - Transforming the data and moving it from Redshift to AWS Sagemaker
L - Loading the data output from redshift into a csv file to read
Using Python to present the data in a data web app
Problem:
In CRM, we had a lack of oversite in what was being sent to customers and how many communications were being sent. We struggled to measure how many campaigns were automated, making it difficult to meet company goals of increased automation of processes.
Solution - ETL - (Extract, Transform and Load)
The process in which the data app was created can be seen above where I will detail how I used ETL processes to reach the end goal.
Step 1: Extract
In order to solved this problem, I first investigated into the necessary database tables to find out what data was available. From the delivery table I found the following:
Template_Label - Name of delivery sent to customers providing data
Broadcast Date - The number of times that delivery was sent from an Adobe workflow
Campaign Code - Information from the Campaign Code on what product the delivery fell under
From this, I was able to experiment with the data and flesh out how I would write my script. The delivery table that I worked on initially had multiple rows for the same Template label for the same date.
So what I needed to do was clean the data but also group the data in stages/levels and the order I did this in can be seen below:
Step 2: Transform
After having this framework, I wrote the SQL to find the underlying data by creating a temporary tables based on product and campaign level.
Most of the time was spent cleaning the delivery label data and bucketing customers into specific product groupings but it eventually resulted into these scripts:
Script 1: Metrics on the ratio of manual to automated campaigns and the % of campaigns that are automated over time
Script 2: The campaigns that CRM are predominantly focused on:
Script 3: The individual deliveries for automated campaigns
Within each of these scripts, you'll see that a lot of the data cleaning went towards cleaning the template name for both the product groups and the campaign name.
Step 3: Load
After the scripts were created, the next goal was to move the data from redshift into Sagemaker/ JupiterLabs and load the data into csv files.
I used a custom library that was built that was based off this site and the following code to read SQL using Python:
import pyodbc
conn = pyodbc.connect('Driver={SQL Server};'
                      'Server=Redshift;'
                      'Database=test_database;'
                      'Trusted_Connection=yes;')
By being able to connect to the redshift server, I was able to read SQL files and output CSV files using the following python script.
Data Unload Code: Streamlit_Manual_automated_Functions.pyBy doing this, it made it a lot easier to create visualizations based off the data whilst also improve app performance.
Stage 4: Writing the Streamlit Python code
Once the csv data was finally sitting in Sagemaker/ Jupiter Labs, I was finally able to practice on what I've learnt and write Python to create the web application.
This stage required a lot of time on experimenting code and reading through the following Python libraries:
Data visualisation libraries - (Pandas, Seaborn, Numpy, Plotly)
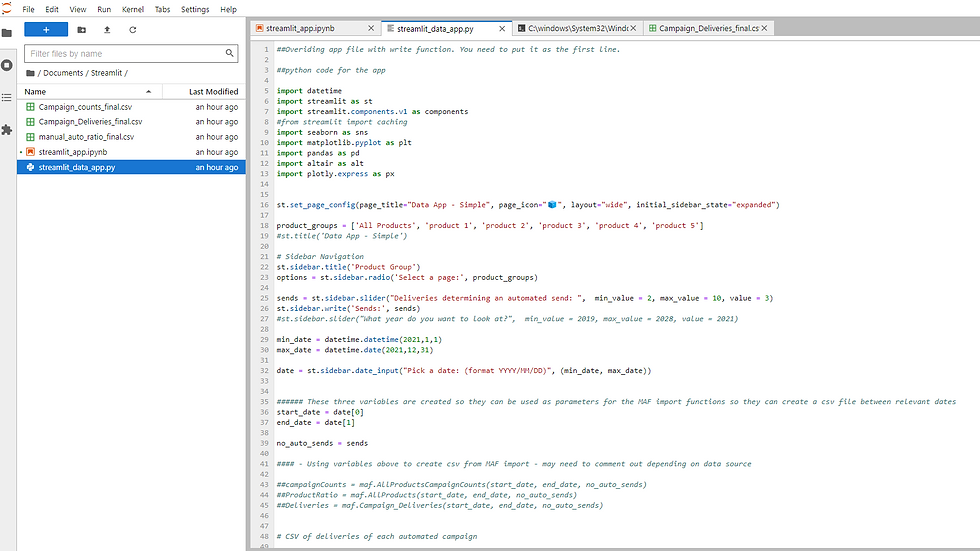
But after this, I was finally able to create a data application. The code for this can be seen here:
## Disclaimer, the code below isn't the code to use for testing the app in your local environment. This code tries to show how to get data from the redshift database.

To run the data app, follow the steps above.
Data App Code: streamlit_data_app.pyFinal Outcomes:
After creating this application, the data team were able to:
Centralize all our deliveries and campaigns onto one dashboard
Plan for future campaigns by seeing what is already being sent out thus improving customer journeys
See the % of campaigns that are manual so it helped focus on what campaigns could then be automated to meet company goals


Comments